|
Matrix will plot
a glaze or a number of glazes on it's % Mol. Parts Triaxial graph.
To display this
graph select the % Analysis Triaxial Graph
item on the View Menu.
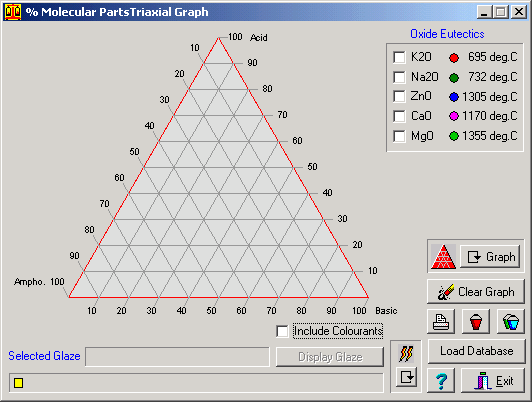
Fig.1
% Molecular Parts Triaxial Graph - Full Mode |
The graph (Fig.1)
opens by default in its full size. This is indicated by the  symbol filled with red.
The graph can be reduced to show the top half of the graph by clicking
the  button.
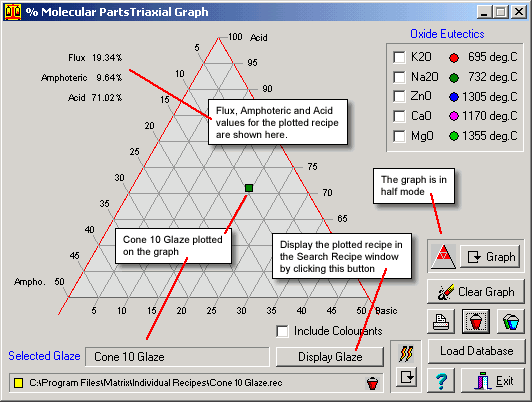
Fig.2
% Molecular Parts Triaxial Graph - Half Mode |
In half graph
mode the symbol changes to  and the scale on the graph changes to
- 0 - 50 for
Basic and Amphoteric oxides and
- 50 - 100
for Acidic oxides.
Plotting
Recipes on the Triaxial Graph
An
individual recipe may be loaded from disk by clicking the
 button and selecting a glaze from the File dialog box. Matrix calculates
the % analysis values for the recipe's formula and plots the recipe's
position on the graph. See Fig.2
button and selecting a glaze from the File dialog box. Matrix calculates
the % analysis values for the recipe's formula and plots the recipe's
position on the graph. See Fig.2
A glaze may
also be sourced from a recipe database by clicking on the
 button. button.
If a recipe
is displayed in either the Recipe to Formula or the Formula to Recipe
environments then that glaze will automaticially be imported into
the % Mol. Parts Triaxial Graph when the graph window is opened.
Plotting
a Group of Recipes on the Triaxial Graph
Matrix will
display all of the recipes in a recipe database. This facility is
very useful for exploring patterns in glazes which have common qualities
and can lead to the ability to predetermine to some extent a particular
outcome for an untested glaze.
To display a recipe database on the triaxial graph click the Load
Database button and select the database you wish to display
from the file selector dialog.
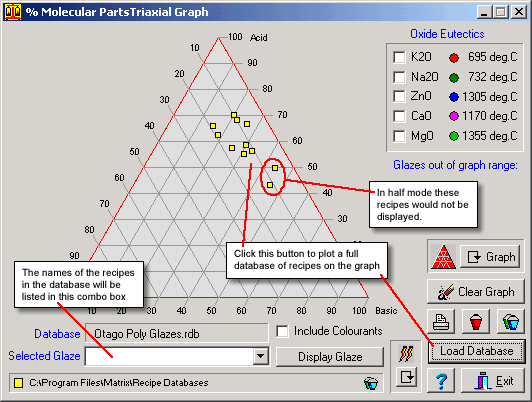
Fig.3
Recipes from Otago Poly Glazes plotted on the % Molecular Parts
Triaxial Graph - Full Mode |
The glazes which
appear on the graph will be listed in the Selected
Glaze combo box which is only visible when the graph
is in Load Database mode.
If you have
the triaxial graph in half-graph mode then some of the glazes in
the database may not appear on the graph. If the flux, amphoteric
or acid values for a recipe in the database lies outside of the
graph parameters then a text box will appear listing the name of
the glaze which has not appeared.
Switching to
full graph mode will make all of the glazes in the database visible.
Identifying
a Glaze on the Triaxial Graph
When you have
displayed a database of glazes on the graph you may identify an
individual glaze by:
- click on
its yellow rectangle.
- selecting
the name of the glaze in the Selected Glaze combo box.
The rectangle
on the graph representing the selected glaze will turn green and
the name of the glaze clicked will appear in the Selected Glaze
combo box. Its 5 molecular parts values will appear to the left
of the graph.
Including
Colourants in the Analysis
In its default
setting the % Analasys Triaxial Graph will not include colourants
in its analysis of the displayed glazes.
If you wish
to include colourants in the analysis then click the Include
Colourants check box.
If the atmosphere
setting is on reduction then any iron oxide in the glaze will be
included in the flux group.
With an atmosphere setting on oxidation iron oxide will be treated
as an amphoteric.
Getting
More Information About the Selected Glaze
If the glaze
selected on the graph was loaded from disk (i.e. an individual file
or from a recipe database) then the full glaze recipe, Seger formula
etc may be viewed by clicking the Display
Glaze button.
This opens the
Recipe Search window which can be expanded to show all available
information on the glaze.
Clearing
Data from the Graph
To clear all data and displays from the triaxial graph click the
 Clear Graph button.
When you exit
from the graph or close the graph window all data will be cleared.
Follow
these links for more information about:
|
