|
If you are involved
in researching glazes or a particular type, firing range, quality
etc you may wish to try and establish a set of limits data which
encompasses the glaze sets you are researching.
Matrix provides
a window in which the formula for all recipes in a recipe database
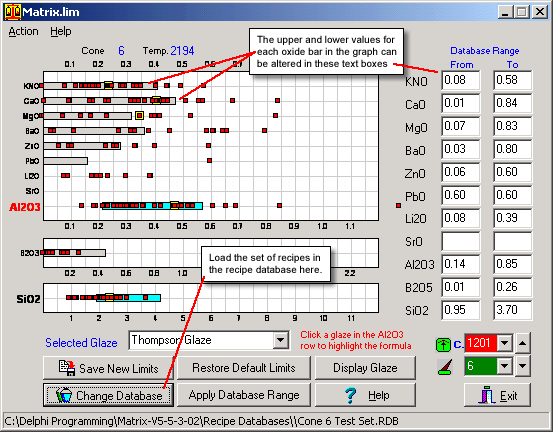
can be plotted. Fig.1
To open the
Recipe Database Limits Graph Window click the Recipe
Database Limits Graph item on the View menu.
Fig
1 The Recipe Database Limits Graph window |
In Fig.1 I have
opened the window and loaded a recipe database called Cone 6
Test Set.rdb This is a randomly selected set of recipes gathered
simple for the purposes of this example.
The graph is
set for the temperature C.6 and the limits data used is the Matrix.lim
data.
Establishing
a New Set of Limits Data for these C.6 Recipes
In Fig.1 the
values in the text boxes on the right represent the upper and lower
values for each oxide in the set of Cone 6 Test Set.rdb recipes.
The bars on the graph represent the upper and lower limits for C.6
in the Matrix.lim file.
If you click
the Apply Database Range button
the bars will change for each oxide to represent the loaded recipe
database.
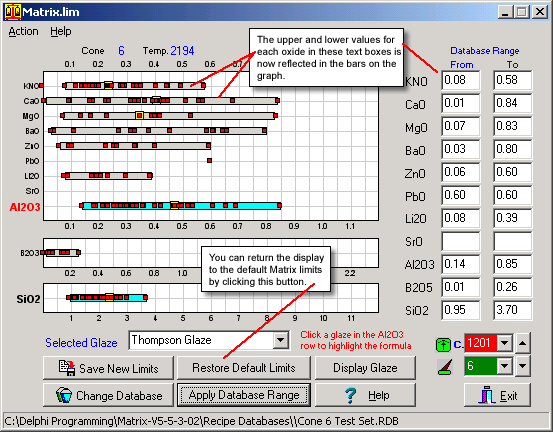
Fig
2 The Recipe Database Limits Graph window after Applying the
Database Range |
You can return
to the Matrix.lim limits by clicking the
Restore Default Limits button.
After Applying
the Database Range you can edit the values to exclude non-typical
recipes in the set.
Saving
the Generated Limits Data for Cone 6 Test Set
When you have
adjusted the values to your liking you may save the data as a unique
limits file for future reference. This file may be used in Matrix
when any Limits Graph window is open.
To save the
data:
- click the
Save As button. The Windows
File Selector in the open directly in the Limits folder.
- type in a
new name for the limits data you have entered and click the Save
button.
When you are
working in Matrix and wish to compare the formula for a displayed
recipe with the limits you have just entered you can use the Load
New Limits File item on the Action menu for whatever graph you are
using. This menu item opens a file selector window and the name
for the new limits data you have entered will appear in the list.
More ...
Follow
these links for more information about:
|
